
Debug DotCraft Desktop
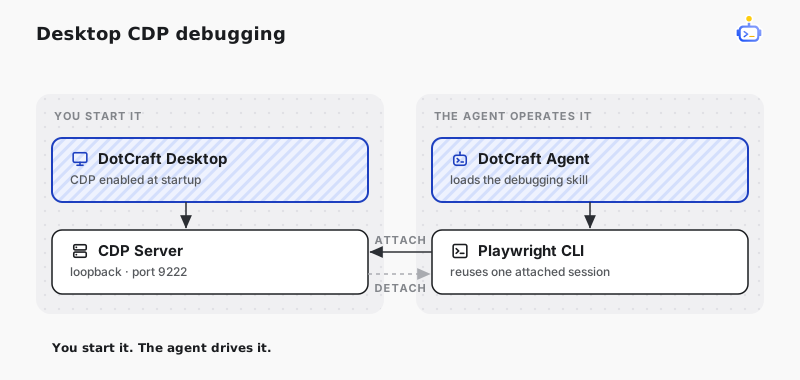
Chrome DevTools Protocol (CDP) lets an agent inspect and exercise the DotCraft Desktop renderer. Once Desktop is running with CDP enabled, the debugging skill manages the attached session and detaches without closing the application.
Install the debugging workflow
The $dotcraft-desktop-debugging skill ships with the official dotcraft plugin. Install that plugin into the workspace before starting a debugging task:
- Open Plugins in DotCraft Desktop.
- Find DotCraft, published by DotHarness, and select Install.
- Review the confirmation, then select Add to DotCraft.
For the complete plugin installation flow, see Plugins and tools.
Start Desktop with CDP
Development environment
From desktop/, run:
npm run dev:debugTo open a specific workspace, forward the workspace argument to Electron:
npm run dev:debug -- -- --workspace <workspace-path>Packaged environment
For a packaged Windows build, start the executable with the debugging port:
DotCraft.exe --remote-debugging-port=9222Both commands expose the fixed loopback endpoint http://127.0.0.1:9222. CDP is enabled when the process starts.
Confirm CDP is enabled

The lower-right status indicator confirms that this Desktop process accepts CDP connections.
Hover or focus the blue status indicator in the lower-right corner. It reports CDP debugging is enabled.
Hand the session to the agent
Describe the Desktop behavior you want inspected and name the debugging skill explicitly:
$dotcraft-desktop-debugging Inspect the current Desktop window and capture evidence for the issue.The agent attaches to the existing loopback endpoint, selects the DotCraft window, waits for the workbench to finish restoring, and reuses one debugging session throughout the task. The attach commands and readiness checks live in the skill so they stay current without being duplicated here.