
Observability
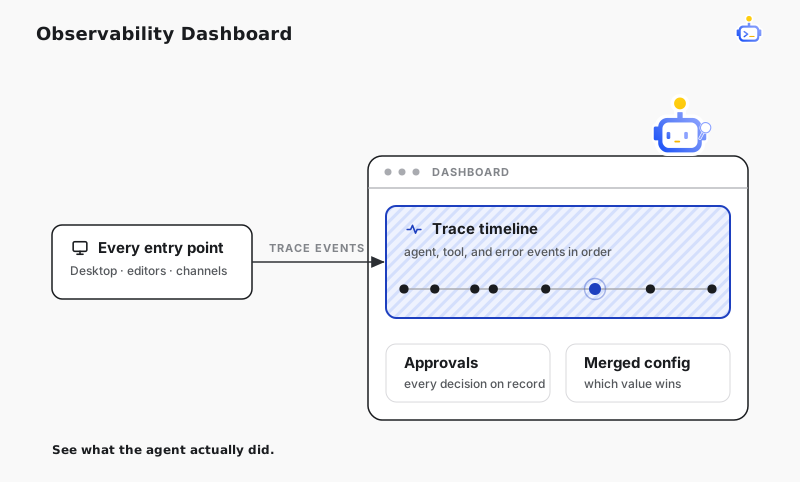
The DotCraft Dashboard is a web page for seeing what the agent actually did. Session traces, tool calls, merged configuration, and approval records all land there. When something goes wrong, you read a timeline instead of digging through logs.
Open the Dashboard
Dashboard is enabled by default — field names and JSON examples live in Entry points and services. Start it:
dotcraft dashboardThe default address is http://127.0.0.1:8080/dashboard. The landing page gives you a runtime summary, entry-point status, and recent activity. Send one conversation from the CLI, Desktop, or any other entry point and the data shows up.
dotcraft dashboard reads what has already been persisted. To watch automations and external channels live, let AppServer host the Dashboard.
Dashboard listens on localhost by default. Point it at an external address and anyone on the same network can open it.
CAUTION
Dashboard shows prompts, project instructions and their source paths, tool arguments, and tool results. Confirm your network boundary and authentication before exposing it publicly.
What each page answers
Confirm the model is responding
Trigger a session and open Trace Timeline. Events are laid out in order: model output, every tool call and its result, and any error along the way. One pass tells you where things stopped.
If there is no model output at all, provider credentials or the endpoint usually don't match — check the merged provider configuration on the Settings page. The Provider filter also shows retry behavior: how many attempts were made, how each one ended, and why retrying stopped.
Diagnose a failed or blocked tool call
Open the session detail under Sessions, switch to the Tools or Errors filter, and click a single call to see its arguments, result, latency, and stderr.
If approval was the blocker, Approvals records every call that needed one: which entry point asked, whether it was approved or denied, and whether the decision came from you, a workspace policy, or a Hook. For the policies themselves, see Security & Sandbox.
See why a config value wins
The Settings page renders the global ~/.craft/config.json and the workspace .craft/config.json side by side: which layer defines each field, which value wins after the merge, and which fields need a restart.
When a change doesn't take effect, check here first whether it applies immediately, needs a subsystem restart, or needs an AppServer restart, then read Settings Lifecycle.
Check the project instructions in effect
The Instructions filter shows the AGENTS.md content the session actually carried and the files it came from. It is a snapshot captured by the thread and refreshed when the thread reloads project instructions, not a live view of the disk.
Check automation and dream runs
Automations lists the automation definitions AppServer hosts, along with their current activity. Dreams is where you review what the background pass produced and decide whether to apply or discard it.
Consume the events yourself
To feed trace events into your own dashboard, the HTTP endpoints and event types are listed in Dashboard API. Dashboard renders that same data, and the AppServer protocol pushes it over Wire Protocol.
Related docs
- Security & Sandbox — which actions need approval, and where Dashboard's blocked records come from
- Server Deployment — run Dashboard and AppServer together on a server